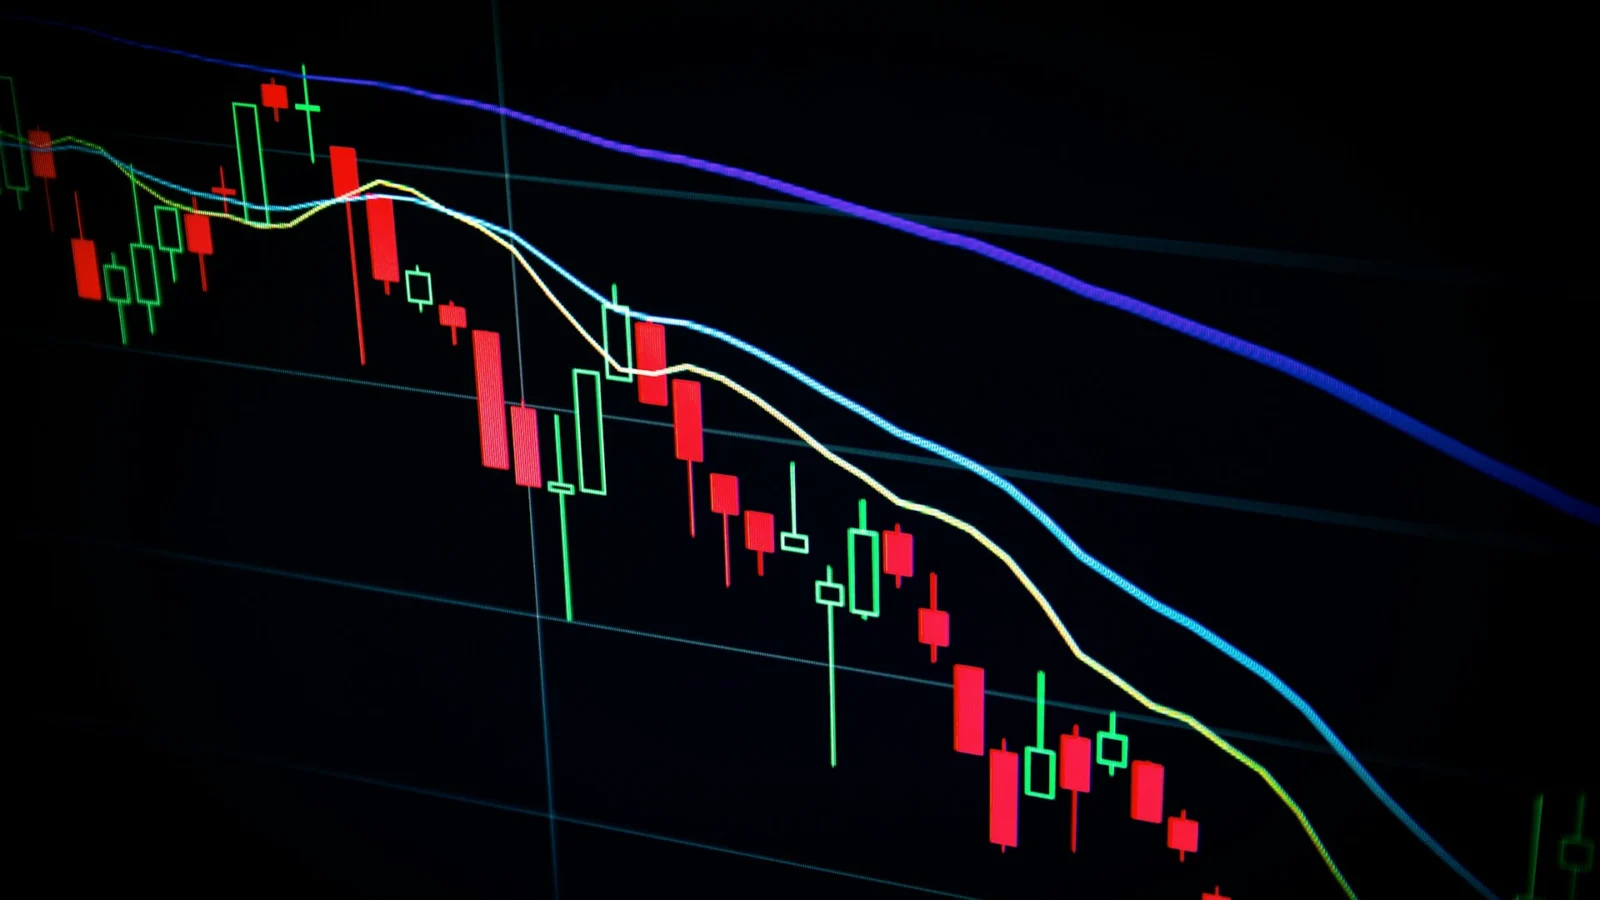
Price charts show what a share has done, not what it will do. Reading them well mostly means knowing their limits.
What charts can tell you
They show trends, volatility and how a price reacted to news. Longer time frames give a calmer picture than daily movements.
Patterns and hindsight
Many named patterns look convincing after the fact and are much harder to spot in real time. Treat them as descriptions, not predictions. This article is general information, not investment advice.






Comments